|
|
The Following paper by Dr. Wagner (modified for this presentation)
appeared in Physiological Chemistry and Physics and Med. NMR (1999) 31:109-129.
Posted with permission from Physiol. Chem. and Phys. and Med. NMR.
ABSTRACT: Experiments indicate that the major plant processes such as the implementation of plant structure, a plant's response to gravity and light, sap flow, and other processes in plants are facilitated by a recently discovered species of longitudinal wave, W-waves. This paper shows how the wave model fits in with the basics of a plant's growth and development. This article takes into account much of the last eleven years of the published work of the author and adds some results that have not yet been published elsewhere. The work reported here answers questions about plants that have not been adequately answered before. For example it provides reasonable mechanisms for a plant's responses to gravity and light.
KEY WORDS: W-waves, gravitropism, phototropism, sap flow, internodal spacings, silicon diodes, Abies grandis (grand fir), Acer microphyllum (big leaf maple), Alnus rubra (red alder), Amorpha fruiticosa (false indigo), Arbutus menziesii (Pacific madrone), Betula pendula (weeping birch), Castanopus chrysophyllum (golden chinkapin), Fraxinus latifolia (Oregon ash), Libocedrus deccurrens (incense cedar), Lonicera hispudula vacillans (a species of honeysuckle), Pinus ponderosa (Ponderosa pine), Populus trichocarpa (black cottonwood), Pyrus malus sp. (delicious apple), Quercus kellogii (California black oak), Salix hindsiana (Hind's willow), Salix sp. (Golden weeping willow)
INTRODUCTION
From its discovery in January 1988 to the present a previously unknown type of non-electromagnetic wave has been studied and found to be fundamental to plant growth and development. These waves appear to be unique low velocity longitudinal waves which travel through plants, through air, other matter, and through the vacuum of space. In fact they appear to be specifically associated with the vacuum of space which permeates everything. The evidence so far seems to indicate that these waves are the factor that makes life and the universe self organizing (Wagner 1999). Many aspects of plant growth and development can be described in terms of these waves designated in 1988 as W-waves because they were first observed in live wood. Experiments reveal that these waves determine plant structure, facilitate sap flow, and provide for a plant's response to gravity and light. These waves not only provide an explanation for the detection of gravity but also explain how the signal is implemented to produce changes in the plant. Plant development is governed by the data stored in the seed's genes and the response of the developing organism coded by these genes to the environment. It would seem that W-waves are a significant part of the environmental pressures exerted on plants. For example the evidence indicates that their wavelengths influenced by environmental conditions determine the dimensions of cells and lengths of internodal spacings. The structure of a plant seems to be tied into the permitted wavelengths of these waves and gravity. Experiments using accelerometers in tree xylem indicate that sap flow is facilitated by W-waves acting on the liquids and structure present in the plant. Energetic aspects of live plant behavior, such as the emission of energetic biophotons, can be related to these waves. Plants seem to be innately tied into the universal vacuum because W-waves travel in this vacuum and thus they apparently reveal characteristics of this medium (Wagner, 1999). Unknown to many the vacuum without ordinary matter present contains enormous amounts of energy. This medium is presently being studied by NASA and others with much urgency because of the unlimited energy present and possibly available for utilization (Puthoff 1997). Plants may utilize some of this energy. The evidence indicates that plants reveal some of the very basic rules by which the universe runs (Wagner 1999). W- waves are presently defined as longitudinal undulations in the dark matter-vacuum medium. They interact with ordinary matter, if it is present, as in plants or in air. In some respects they behave like sound waves but calculations reveal that the media do not behave like an ideal gas (Wagner 1995 p.167).
MATERIALS AND METHODS
Here the experimental methods detailed in referenced articles are reviewed. First characteristic wave behavior was found by electrically monitoring multiple probes in or placed on the surface of plant xylem tissue (Wagner 1988). Extensive measurements were made of internodal spacing lengths and of plant cell lengths using linear measuring devices (see all the Wagner references). Certain aspects of plant behavior were determined by placing insulated silicon diode dies into thin level slits in plant tissue and measuring the voltages therefrom as a function of the time of day (Wagner 1993.). Weights and accelerometers were used in tiny holes in plant tissue to find out if plants produce forces to facilitate sap flow (Wagner 1992, 1995). Wave velocities were measured by time of flight methods both within and without plants (Wagner 1988, 1989, 1996). Rotating dust tubes seem to demonstrate the existence of W-waves outside of plants (Wagner 1998). Much of the work involves electrical measurements thoroughly described in the references. Other methods are discussed in the main text. All measurements are extremely simple and reproducible. In the following two paragraphs the methods are described that were used in the obtaining the new data reported in this paper.
Thin section xylem samples from various species of trees were taken from vertical tree trunks and from branches making various angles to the horizontal. In preparing to measure tree xylem cell lengths these thin section samples were macerated in equal parts of 10% nitric and 10% chromic acid for about 36 hours at room temperature. The resultant material was then washed with water using a microcentrifuge. After washing and cell breakup the material was placed in petri dishes where glycerol was added to prevent drying. Sufficient material was then placed on slides for measurement on a microscope using a magnification of usually four. In all cases 325 or more cells were measured for each fiber angle. These angles included 0 and 90 degrees with the horizontal as well as angles in between. The cell measurements were placed on a spreadsheet, converted to frequency by taking reciprocals and multiplying each reciprocal by a velocity. The frequencies and lengths were analyzed by taking means, standard deviations, and distributions.
Dust tubes were prepared from 120 cm long pyrex tubes. They were closed on one end with a spout on the other end to permit adding or removing dust particles. 15, 20, 25, and 37.5 mm diameter tubes were used. From 5 ml to 20 ml of dust was placed in a particular tube. The material in the dust tube was usually prepared from material such as soft rock using a mortar and pestle. A gradation of particle sizes seemed to work best. The material was ground up such that the largest chunks were around 1 mm in diameter. The amount placed in a tube was determined by the diameter of the tube with the larger tubes containing the larger amounts. In some cases the tubes were evacuated so that air was eliminated as a factor in pattern formation. One tube was evacuated, fitted with air bearings, and rotated with a four blade propeller using a slow stream of air in one of the attempts to eliminate sound affects. Most tubes, however, were belted on one end to a pulley, which could be varied in size, on a geared down shaded pole motor. The belt was made either of Duct tape or electrician's tape. Most often the motors and tubes were mounted on separate mounts to prevent sound transfer from motor to tube. Tubes usually rode on upside down pairs of hard rubber castors with an extra castor mounted so that it pressed on the top of the tube on the belt end to prevent the tube from pulling out when the tube was rotated. Spacings were measured between course piles, after rotation, starting at one end of the tube. The spacings were first divided into one half the assumed wave velocity in the tube to obtain frequency because distances between antinodes (or nodes) on a standing wave is one half a wavelength.
DISCOVERY OF W-WAVES AND BASIC WAVE THEORY
In January of 1988 small cylindrical blocks were cut quickly from the bases of small trees, the bark was then peeled, and then the block probed for electrical voltages. Using a probe at the bottom of the block for a reference I probed up the block. A near sinusoidal (with distance up the sample) voltage pattern slowly developed within a few minutes after cutting and then disappeared in about twenty minutes or so. It was concluded that unique standing waves were producing the patterns due to reflections from the cut ends of the samples (Wagner 1988). Similar measurements were then made on whole trees (Wagner mostly unpublished). The distances between peaks were orders of magnitude larger on whole trees. It appears that the spacings telescoped into the smaller blocks that were cut out. This early data suggested that plants are wave operated. For example hundreds of probes separated by equal distances were placed up tree trunks and the voltages were plotted from the probes as a function of the distance up the tree. These probes again produced sinusoidal like patterns (Wagner 1988). I found that a low frequency spectrum analyzer gave unique frequencies that could also be found by measuring internodal spacings and calculating frequencies (f) using the predetermined velocity (v) for the waves (f=v/l; l is wavelength which is twice an internodal spacing as already explained ) . I measured the velocity of the waves by wounding trees and observing the changes in the output voltage from probes above the wounds as a function of time (Wagner 1988).
One experiment provided a particularly powerful argument in
favor of the waves as evidenced by probes. I placed two probes one and one half
meters apart up the trunks of trees about ten meters high. I connected these
two probes through grounded coaxial cable to a strip chart recorder with an
input impedance of 10 megohms. I then chopped into the base of the tree with
a woodcutters ax (or otherwise quickly wounded the tree). The wave pulse passed
upward past the two probes producing signals on the strip chart recorder that
gave me an initial measure of the wave velocity. The signal went on up the tree
was reflected back down and the time of arrival at the top probe was again recorded
on the strip chart recorder. Knowing the height of the tree then provided yet
another measure of the wave velocity. The wave pulse went on down the tree and
registered its passing on the lower probe and I could calculate the velocity
a third time from one ax chop. All three measurements provided the same velocity
(Wagner 1995 p. 19)! The experiments were repeated many times with similar results.
The waves traveled much too slowly for sound waves but much too fast for ion
movement. It was observed that wounding one tree produced delayed electrical
changes from probes in one or two nearby trees. Thus one can measure the velocity
of the wave signals traveling between trees (Wagner 1989) (Figure 1).
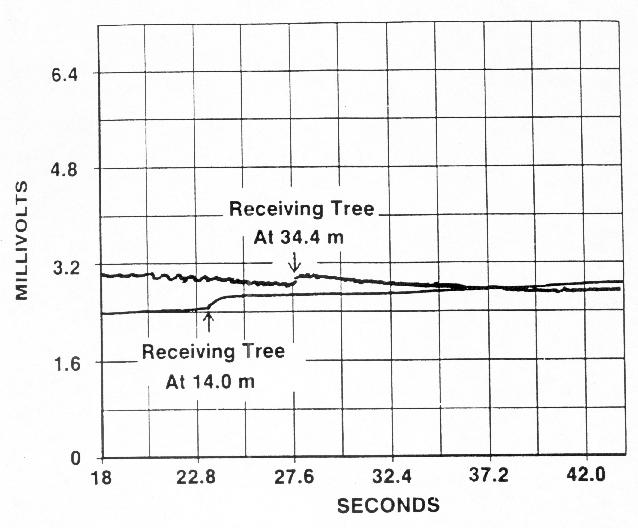
FIGURE 1. Curves from a strip chart recording of the response of two receiving trees to a woodcutters ax chop to a transmitting tree. The time on the abscissa is the approximate time from the ax chop. All three trees were ponderosa pines (Pinus ponderosa) near 10m in height. The elapsed time between the two disturbances marked with arrows was used to calculate the velocity of W-waves between trees. Note that normal delays in response were eliminated by the use of the two marked disturbances (Wagner 1989).
Periodically spaced probes indicate that W-waves have specific wavelengths . The wavelengths combined with the measured wave velocity facilitated the calculation of frequencies for these waves. I then hypothesized that plant internodal spacings are determined by half wavelengths (distances between nodes on a standing wave) of W-waves in plants. Several thousand internodal spacings were measured (Wagner 1990) and it was assumed that a spacing represented a half wavelengths of a standing wave in plants. From the spacings one could calculate frequencies using the previously determined velocity. Next W-wave frequencies were measured with a low frequency spectrum analyzer. These frequencies agreed with the frequencies calculated from internodal spacings.
PLANT STRUCTURE IN THE WAVE MODEL
Much work has been done in the past on plant morphogenesis
(e.g. Sinnot 1960). Measurements indicate that W-waves strongly influence the
implementation of the structure of all plants (Wagner 1990, 1996). In the W-wave
model one would expect a forced node at the end of a plant stem because of a
wave discontinuity at the boundary between the plant and air. Apparently on
new growth the stem lengthens by one of a large set of permitted half wavelengths.
Genetics and environmental conditions determine the choice of the new length.
If little moisture for growth is available, for example, a short length from
the pool of available wavelengths might result.10's of thousands of plant internodal
spacings were measured observing in the process that spacings repeat from plant
to plant thus confirming that there is a set of available spacings (Wagner 1990,
1996, and unpublished) (Figure 2). Low frequency spectrum analyzer data also
confirms that there is a discrete set of W-wave frequencies and thus available
spacings (Wagner 1990 and all the Wagner references).
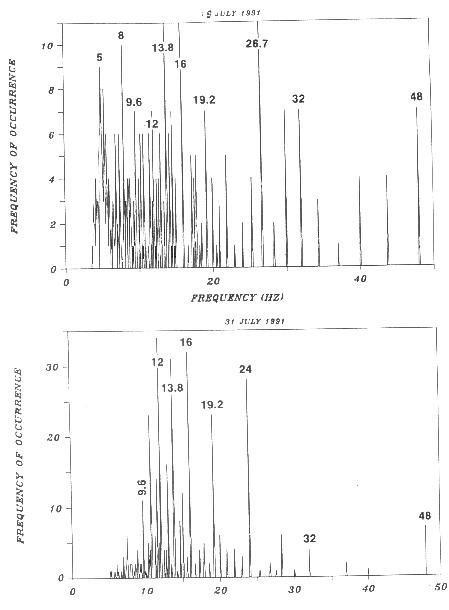
FIGURE 2. Distributions of frequencies derived from internodal spacings from (top) honeysuckle vines (Lonicera hispidula vacillans) and grand fir (Abies grandis). Notice the discrete peaks and labeled frequencies. The frequencies were derived using 96 cm/s as the W-wave velocity. The value labels are typical of plants with values repeating from plant to plant seeming to indicate a pool of available frequencies for determining internodal spacings on plants.
Cell lengths (tracheids, vessel elements, and/or true fibers)
from the surface xylem of various species of trees were measured. These lengths
also appear to be discrete (by statistical rules Wagner 1990) indicating wave
behavior (e.g. Figure 3). Gravity appears to play a very important role in these
cell lengths. In general vertical cells are longer on average than horizontal
cells. The length difference is also true for plant internodal spacings (Wagner
1990, 1996). In the cell length data taken so far it appears that some cells
from some tree species grow differently than others. In some trees the horizontal
cell lengths are almost the same for both vertical and horizontal. The vertical
cells mean lengths, however, are still at the least around 10 % larger than
horizontal lengths. For example see Table 1 for some of these. The internodal
spacings in these cases still show the usual ratios, however ( Table 1 and Table
2). In comparing average horizontal and vertical lengths in plants reciprocals
of these lengths were taken. Then these reciprocals were multiplied by a velocity
( 96 cm/s) divided by two to give a frequency. Thus one can plot frequency of
occurrence versus frequency in Hertz providing a frequency distribution. Averages
and standard deviations of the frequencies were obtained for a particular angular
orientation of fibers from a particular species.
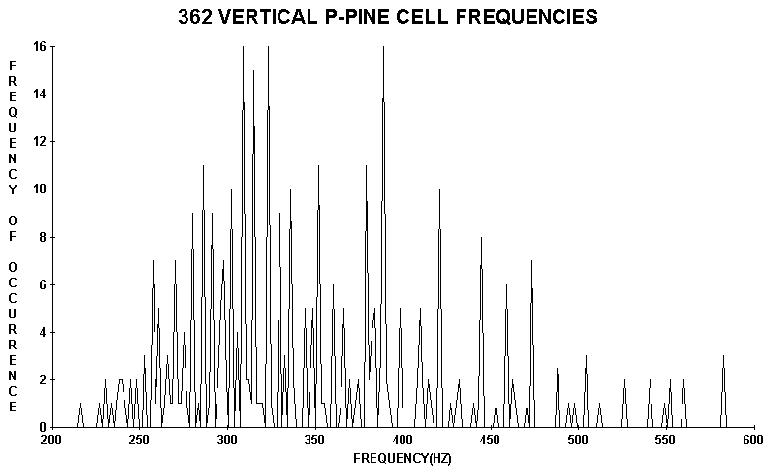
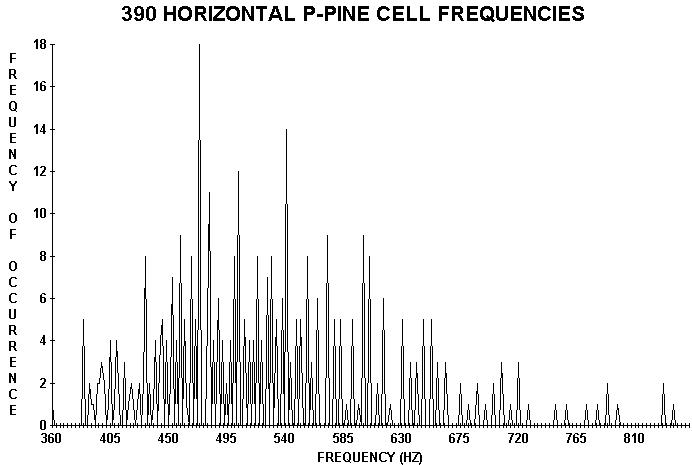
FIGURE 3. Distributions of vertical (top) and horizontal xylem cell lengths converted to frequency from cells (taken from the trunk and a branch respectively) of a three meter high ponderosa pine tree. Again note that the lengths appear to be discrete. Taking the ratio of the average of horizontal values to the average of the vertical values gave 1.50 (exactly) in spite of the large standard deviations of the individual quantities. This ratio was a surprise because it also appeared in taking similar ratios derived from average spacings on other plants including needle spacings on trees including conifers like Douglas fir, grand fir, red fir, and subalpine fir (see the text).
Most often the ratios of average horizontal frequencies to the corresponding vertical average gave very unique ratios like 3.0, 1.66, 1.5, 1.33, and 1.25 that repeated from species to species (Wagner 1996) (Tables 1 and 2). These are ratios of small integers. In Figure 3 the corresponding ratio for cell lengths is 1.50 exactly. These calculated ratios appeared to be unique velocity ratios (or mean frequency ratios) after I compared them to ratios of actual measured velocities (Wagner, 1995, 1996)! Actually the latter are calculated as frequency ratios rather than velocity ratios but I early assumed that velocity differences could provide the ratios. Both effects are probably present. So far it always appears, from these measurements, that vertical W-wave velocities in plants are greater than the horizontal velocities (Wagner 1996). A plant appears to use velocity anisotropy at least in part to determine how it responds to gravity. The response is then echoed in the structure as required by the genetics of a particular plant. Notice that for a given frequency a wavelength is larger for a larger velocity (wavelength equals velocity divided by frequency). The velocity or mean frequency ratio idea as a standard is confirmed by plants in space experiments where plant cells may sometimes even grow round due to a lack of a gravity reference (Halstead and Dutcher 1988).
| CELL RATIO | INTERNODAL SPACING RATIO | |
| Delicious apple | 1.08 | 1.33 (4/3) |
| Red alder | 1.04 | 1.70 ( 5/3) |
| Big leaf maple | 1.01 | 1.50 (3/2) |
| Golden Chinkapin | 1.09 | 1.56 ( 3/2) |
| Black cottonwood | 1.16 | N.M. |
| Ponderosa Pine (4m) | 1.50 | 2.99 (15m) (3/1) |
| Douglas fir (10m) | 1.62 | (8/5) 1.49 ( growth leader needle spacings) |
| Grand fir | 1.62 | (8/5) 1.51 ( growth leader needle spacings) |
| California black oak | 1.53 | N.M. (3/2) |
| Pacific Madrone | 1.46 | N.M. (3/2) |
| Oregon Ash | 2.58 | N.M. (5/2) |
| Incense cedar | 2.57 | N.M. (5/2) |
TABLE 1. More than 300 vertical cell lengths were sampled from xylem surfaces of each of the listed tree species. Reciprocals of these lengths were taken and then these were averaged. The same thing was done for the horizontal (and for angles in between as discussed in the text). The ratios of the horizontal averages to the vertical averages respectively were then listed above. Some of the ratios match those of similar ratios taken for internodal spacings (for example Table 2). N.M. means not measured probably because it was quite difficult to obtain a good horizontal and vertical internodal samplings on these particular trees. For more internodal spacing ratios see Wagner 1996. Many of the ratios obtained are close to ratios of small integers as indicated.
| Species | # of spacings | Reciprocal ratio (H/V) | Possible velocity ratio |
| B.L. maple | Hor. 205 | 7.10/4.81= 1.48 | 288/192=1.50 |
| Ver. 122 | |||
| G. W. willow | Hor. 760 | 27.99/16.83=1.66 | 480/288=1.66 |
| Ver. 685 | |||
| False indigo | Hor. 361 | 39.34/29.54=1.33 | 384/288=1.33 |
| Ver. 376 | |||
| Del. apple | Hor. 618A | 29.99/21.68=1.33 | 384/288=1.33 |
| Ver. 636 | |||
| W. Birch | Hor. 380 | 28.35/22.71=1.25 | 480/384=1.25 |
| Ver. 553 | |||
| G. chinkapin | Hor. 657 | 45.76/29.32=1.56 | 288/192=1.50 |
| Ver. 373 | |||
| P. Pine | Hor. 429 | 3.25/1.09= 2.98 | 288/96=3.00 |
| Ver. 164 | |||
| Hind's willow | Hor. 472 | 57.68/39.01=1.48 | 288/192=1.50 |
| Ver. 794 | |||
| Red alder | Hor. 862 | 15.93/9.38=1.70 | 480/288=1.66 |
| Ver. 278 |
TABLE 2. Ratios (H/V) of the means of reciprocals of horizontal and vertical internodal spacings from 9 species of trees and shrubs. The ratios here could be due to differences in velocity between vertical and horizontal or due to difference in frequency averages as was indicated in Table 1 for data taken from lengths of xylem cells. In Wagner, 1996, it was assumed that velocity ratios are involved, since I measured integral multiples, but the cell data given in this paper may imply frequency ratios which was a possibility given in Wagner, 1996. It is believed plants can utilize both different velocities and different frequencies in gene implementation of plant structure.
In many trees (e.g.. Oregon ash, Pacific Madrone, Black cottonwood,
California black oak, and incense cedar) cell lengths in structures making angles
different from 90 degrees and 0 degrees with the horizontal were sampled. The
frequency averages from these samplings for a particular tree were then plotted
versus angle (for values see Table 3). These plots resulted in near or completely
straight lines. Any deviation from straight lines can be explained by sampling
error. For example the two following conditions were found to contribute to
possible sampling errors: (1) More long cells than short ones are included in
clumps where cells could not be measured and/ or (2) The angle of the branch
or trunk was measured incorrectly because of irregular bark etc.
| 0o | 5o | 45o | 65o | 75o | 80o | 85o | 90o | |
| Oregon ash | 1110 | 820 | 551 | 431 | ||||
| P. madrone | 1317 | 1007 | 877 | 775 | ||||
| B. cottonwood | 936 | 876 | 829 | |||||
| C. black oak | 642 | 493 | 420 | |||||
| Incense cedar | 503 | 358 | 195 |
TABLE 3. Each number in the table was found by measuring the mean lengths of more than 300 typical random xylem cells. The reciprocals multiplied by one half of 96 cm/s were then averaged to obtain the mean frequencies shown (rounded to the nearest whole number). The cell angle given is the minimum angle that the branch or trunk made with the horizontal at the location where the sample was taken. Samples were taken from the top of a branch in general although bottom samples didn't appear to give much different results. If one plots angle versus mean frequency for a particular tree one obtains almost perfect straight lines in each case shown here.
What is amazing is that the averages come from distributions
with large standard deviations (as with the ratios for internodal spacings).
The standard deviations for the frequencies used in Table 1 ranged from 15%
to 36% of the frequencies with only 11% above 25%. In Table 2 the standard deviations
of the frequencies used in the calculations ranged from 39% to 91% of the frequencies
used in the calculations. These latter were for internodal spacings. In Table
3 the standard deviations ranged from 16% to 46% of the frequencies used with
76% less than 30%. The plant's processes, however, make the means come out correctly
to produce repeatable ratios and straight lines! What appears especially important
is that in spite of large standard deviations for the averages they always seemed
to provide similar results. This is reminiscent of quantum (or wave mechanics)
for elements and molecules where means are considered more important than individual
values. Note that the means of lengths don't generally produce straight lines
when plotted versus angle but means of reciprocals do which one would expect
if lengths represent wavelengths or half wavelengths. It would appear that the
cell frequency averages should be proportional to the sine of the angle rather
than the angle alone because this gives the component of gravity present at
the particular cell angle. This does not appear to be the case, however. The
quantized plant angles observed earlier (close to integral multiples of five
degrees), shown in. Figure 4 and Wagner, 1997, also indicate a linear relationship
with angle. The conclusion from the work, so far, is that plant genetics has
many discrete variables at its disposal so that the gravity response can produce
the proper form of a plant for a particular species or mutant. The variables
include many frequencies and many velocities. The available variables are limited,
however, so that a plant does not violate the second law of thermodynamics in
its formation (Sargent and Beckwith 1993). The rules of W-wave mechanics seem
to provide a template for the organization of life just as quantum mechanics
provides a template for the organization of matter.
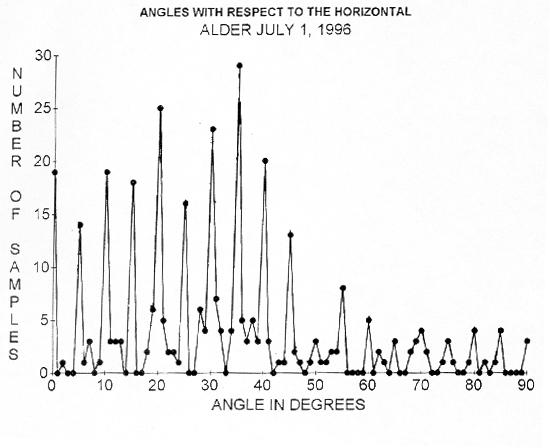
FIGURE 4. The distribution of angles for 337 angles (mostly on branches) measured with respect to the horizontal on red alder (Alnus rubra). The distribution indicates that the measured angles almost all within 1 degree of integral multiples of five degrees (88%). I also did similar measurements on big leaf maple (Acer macrophylla), Douglas fir (Pseudotsuga menziesii), weeping willow (Salix sp.), hazelnut (Corylus sp.), and ponderosa pine with similar results.
In summary the data indicate that there are sets of different frequencies of standing waves in plants. The range of frequencies (and thus wavelengths) permit the plant to produce cells of different types for a given angle. A particular standing wave in a plant likely produces an envelope that stays in place for a considerable time. This permits the standing wave to be a template or pattern for the formation of a cell if that is what the genetics code requires. Standing wave envelopes even look like plant cells. A string of cells could be produced from a particular standing wave pattern. In the wave hypothesis a branch normally extends by at least a half wavelength of a particular frequency ( the choice depends on the environment), present in the plant to form a new internodal spacing.
A PLANT'S RESPONSE TO GRAVITY
Much work has been done relative to a plant's response to gravity but it is still poorly understood. For a review of some of the classical gravitropism studies see Salisbury 1993. Apparently a plants genetics are innately connected to W-waves which help guide plant structure. A plant's response to gravity appears to depend on the species indicating genetic involvement, what part of the plant is involved, and other factors. As discussed in the previous paragraph ( and elsewhere e.g. Wagner 1996) a plant's response to gravity in the wave approach seems to be based on differences in velocity and/or frequency between waves traveling vertically and horizontally and angles in between. It appears that a growing plant stem acts like a tuned wave guide with the guide's characteristics determined by the velocity and frequency of the W-waves coursing through it. A specific mean frequency, for example, apparently is determined by the angle at which the plant part is growing with respect to the gravitational field. A stem growing at a certain angle to the gravitational field adjusts its cell sizes, internodal spacings, and other structures to conform to the wavelengths associated with that particular angle. If the stem is bent from that angle the structure no longer conforms so electrical currents are produced, endogenous plant growth regulators are produced, reaction wood, and other effects result to produce a correction. If the stem is bent downward the cells on the bottom side are compressed and many shortened. Apparently wavelengths going through the stem match those of the unbent stem so the shortened cells are out of tune with the usual waves i.e. the cells match shorter wavelengths so the plant produces signals which the genetics of the plant recognize as requiring the production of reaction wood or the production of growth regulators that produce reaction wood etc. Besides being a physicist this author was also trained as an electrical engineer. Thus I like to compare each cell or internodal spacing to a radio antenna. If an antenna is not of proper length for a particular frequency of transmission large amplitude standing waves are produced in the transmission line to the antenna with very little power left for radiation into space from the antenna. This analogy may be helpful in understanding the wave phenomena involved here.
In the past it has been observed that starch falling in a plant has something to do with a plant's response to gravity. The displacement of the starch to one end or side of a cell could effectively shorten the length of the cell for the waves either along or across the cell if more starch increases the W-wave velocity. To compensate the plant would effectively try to produce cells with new dimensions to produce a correction. It is likely that certain substances interact more strongly than others with the traveling or standing waves to produce wavelength changes or velocity changes, with corresponding changes in the lengths of the W-wave standing wave envelopes, so their presence or lack would have a large effect on the gravity response. Such substances could also be growth regulating substances that encourage or inhibit growth. This growth encouragement or inhibition may arise because the substance increases or decreases the wavelength (or velocity) of the W-waves present if wavelengths determine cell dimensions. Much study needs to be done to determine how different substances, such as starch, interact with W-waves so that the plant interactions can be analyzed in more detail. I am presently studying how to better generate W-waves so that some of these questions can be answered directly. W-waves seem to be generated by certain electromagnetic configurations. The sun seems to be a major source of W-waves (Wagner 1999). Note that one can compare the interaction of W-waves with different substances to interactions of light with different substances. In optics the velocity of light is dependent on the type of substance. This fact is used in producing lenses and other optical devices.
One of my most interesting observations is that many trees and other plants have branches that seem to grow for relatively long distances at specific (discrete) angles to the gravitational field. For example I found a complex red alder (Alnus rubra) branch where every part appeared to be growing nearly perfectly level including the secondary branches even though the branch extended from the tree for more than 2.5 meters. This kind of straight growth behavior was observed on various branches for other angles to the gravitational field so several thousand of the angles were measured, with an appropriate "smart level". Actually angles were measured with respect to the horizontal since these complementary angles were easier to measure (e.g. Figure 4). The results so far indicate that plants tend to grow at integral multiples of near five degrees with respect to the horizontal (or vertical) (Wagner 1997). The latter kind of behavior can only be explained as a wave phenomenon. Apparently the mean frequencies are permitted by quantum like rules to change only by a certain fixed amount. For each angle there appears to be a complete set of frequencies (and/or velocity range) that provide for a set of particular cell lengths or internodal spacings.
I believe that the proposed wave model' for a plant's interaction with gravity, is the first one suggested that takes care of all three usually mentioned steps in a plants response to gravity (perception, transduction, and response). In the wave approach there is a set of wavelengths for every equilibrium discrete angle that a stem makes with the gravitational field (Wagner 1997). Apparently any displacement of a cell from an equilibrium angle produces a mismatch of cell dimensions and wavelengths and the plant responds accordingly within the realm of the particular plant's genetics. In a branch that has been bent down many of the cells on the lower side of a branch would tend to be compressed and thus shortened. The changes in length of the plant parts prompt the plant to correct by growing longer cells on the lower side of a branch, for example, to correct for a match to the original set of wavelengths. More study of the classic experiments needs to be done to fit every detail into the wave model. The wave approach seems to provide a very simple explanation for a plant's total response to gravity.
An interesting result that correlates with the data in Table 3, where frequencies increase with decreasing gravity or angle with the horizontal, is the observation that circumnutation frequencies in sunflower shoots increased in frequency in a microgravity environment (period in microgravity 88 minutes; for the control on earth 105 minutes) (Johnsson 1999). For the Table 3 microgravity corresponds to horizontal and full gravity to vertical. We assume that the more horizontal the growth the less the influence of gravity.
In summary in the wave approach to a plant's response to gravity, specific cell dimensions and internodal spacings are associated with a set of wavelengths for each angle that the plant part makes with the gravitational field. In new growth the plant must obey the wave rules. These rules permit much latitude for the implementation of genetic requirements.. The data seem to indicate that the standing waves form a template or pattern for cell growth. If there is any change in effective cell dimensions due to compression, extension, or displacement of starch a mismatch occurs between wavelengths that determine dimensions and actual dimensions. A mismatch also occurs if the angle that a plant part makes with the gravitational field is changed. One of these mismatches is sufficient cause for the plant to initiate corrections with growth regulating substances or change growth patterns. A good example would be where a bent branch produces reaction wood to restore its original angle to the gravitational field. In the wave theory one can see that the whole plant is sensitive to gravity. Certain parts of plants, perhaps starch-statoliths (Volkman and Sievers 1979) and specialized statocytes in root caps, apparently are specialized to provide more sensitivity to gravity so that growth can be controlled more appropriately.
A PLANT'S GROWTH RESPONSE TO LIGHT
Again for a classical discussion see Salisbury 1993. I found that electromagnetic sources seem to excite W-waves of specific wavelengths in plants. I made measurements in the laboratory using W-wave detectors around electromagnetic sources and found larger amplitudes of certain commonly observed W-wave frequencies. These waves then modify the structure of the exposed plant apparently because of their large amplitudes. For example it was found that 60 Hz fields around electric power substations seems to narrow the distributions of internodal spacings in plants by eliminating many of the shorter internodal spacings representing higher frequencies(Wagner 1995 pp. 129-143, 1996). Also in the laboratory it seemed to be possible to change the spectrum of spacings in dust tubes rotating in the presence of relatively strong electromagnetic sources (Wagner 1998). These tubes have spacing distributions remarkably similar to plant spacing distributions (see the later section on W-waves outside of plants). It is hypothesized that the electromagnetic fields absorbed by pigments in the plant subtly alter plant growth by exciting different plant W-wave frequencies. This effectively increases the amplitude of these frequencies in the plant producing cells that match these new frequency wavelengths. Endogenous plant growth regulators are involved in the observed processes but it is not yet understood how the regulators get to the correct places at the correct times in the implementation of the wave action.
When sunlight shines on a plant it is hypothesized that the result is that W-wave wavelengths are produced within the plant that encourage the growth of cells that are shorter than the cells grown in dark portions of the plant. Longer cells in darker portions of the plant apparently grow because the mean W-wave wavelengths produced in the plant are of longer wavelength. These ideas are consistent with the idea that shorter wavelengths of light produce shorter wavelength W-waves within plants while longer wavelengths of light produce longer wavelength W-waves. In direct sunlight, for example, short blue and violet wavelengths are more dominant than in reflected light for most plant situations. This discussion may be an over simplification but it seems to make sense in terms of what has been learned so far about W-waves. Growth regulators may speed up or slow down W-waves to produce longer or shorter standing wave envelopes for patterns or templates for cell production. Much of the work done by others is still controversial (Frank Salisbury 1998 private communication). Notice that the growth of shorter cells on the lighted side of a plant would tend to make a plant bend toward the light as is observed.
SAP FLOW
The usual adhesion-cohesion hypothesis explanation for sap
flow has been under attack for the past few years (e.g. Zimmerman et. al. 1995.).
I'm confident that most of the proposed mechanisms are still present to some
degree but these apparently are not the whole story. Suction by evaporation
from leaves is obviously a factor. In the history of sap flow theory the oldest
hypotheses suggested that sap was pumped but no proof was found so the idea
was generally abandoned. In the W-wave case, experiments suggest that sap is
pumped all along its path by forces in the plant. Evidence for these forces
was found by using tiny accelerometers in small holes in xylem tissue of trees
(Wagner 1994). I was also able to find these forces in vertical holes in slightly
leaning trees using tiny hanging weights (Wagner 1992). In holes in trees decreases
of up to 22 % of the acceleration for gravity (g) were measured (Figure 5).
The observed forces also were measured in a hole along a horizontal root so
the forces apparently do not reduce gravity but tend to cancel it in a vertical
stem (Wagner 1994). Inside the plant tissue itself likely the forces are much
larger. The observed forces perhaps can be explained by standing W-waves moving
up the plant. Standing waves make a good model because they seem to be so important
in other aspects of plant growth and development. I have been able to move dust
along a tube by moving standing sound waves and I can produce moving standing
waves in an ordinary fluorescent tube (Wagner 1998). Experiments suggest that
all the wave phenomena are related to the very energetic universal vacuum mentioned
in the introduction and some of this energy may be involved in sap flow (Wagner
unpublished). (see the June 1998 issue of Physics Today p. 19 for the possible
enormity of the energy in the vacuum)
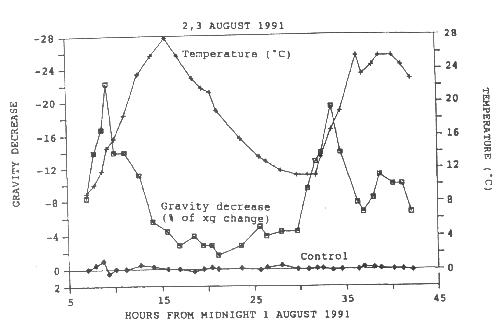
FIGURE 5. An acceleration change curve taken from Oregon ash (Fraxinus latifolia) for August 2 and 3, 1991. The temperature change is also given. The maximum measured change in acceleration (August 2) was 22% of the acceleration of gravity at sea level. The temperature change is also given. This value was for the accelerometer base resting on the bottom surface of a 3.0 mm wide x 3.5 high x 17 mm deep hole in the tree xylem compared with the values outside the hole. Note that the acceleration changes represent decreases in acceleration. The zero baseline represents no change in acceleration. The curve about zero is the control result taken from dead wood. (see Wagner 1995)
THE WAVE ENERGY DENSITY OF W-WAVES IN PLANTS
The wave processes in plants are demonstrated to be very energetic
as the following described experiments indicate. The most simple experiment
that not only proves this but also proves the wave hypothesis (Wagner 1993)
is the time dependent voltage coming from an silicon diode die, insulated from
the tree, placed level in a horizontal slit in the xylem and loaded with a resistor
(Figure 6). These experiments reveal that W-wave processes can be very energetic
with perhaps energies for a "wavton" (defined here as a unit of W-wave energy
analogous to the energy of a photon) given by a constant multiplied by the frequency.
The highest voltages (near 8.0 volts) recorded coming from these diodes driving
a 10 megohm load were recorded in September (1991) with the P layer negative
(reverse biased) and facing upward (A silicon diode die is composed of a P-layer
and an N-layer). Calculations from using a parallel load revealed that the diode
acted as a 1 megohm source with about 0.03 w/cm3 present. This indicates
relatively high power density in the tree since most of the energy would probably
penetrate the diode rather than coupling into it. The data, so far, indicate
that the highest voltages are recorded in the fall. This is also indicated by
ordinary bioelectric tests with fall voltages of near one volt from a pair of
steel probes placed up a tree trunk. Similar tests in early spring gave less
than 100 mv. A test in May 1997 produced voltages of at most 500 mv from a diode
in a tree similar in size to the one producing 8 volts, in the fall, in the
published experiment.. The top layer (P) being negative for most of the time
is consistent with ordinary bioelectric probe tests that I have made with the
upper probe most usually indicating negative. The negativity seems to be related
to the gravitational field rather than the earth's surface electric field. The
diode thickness (0.25 mm) may indicate that a dominate W-wave frequency producing
the voltage is 1920 Hz (Wagner 1993).
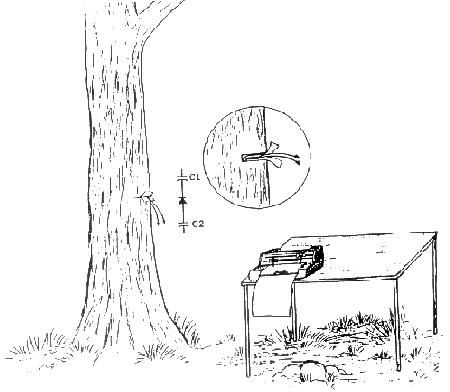
FIGURE 6. A schematic drawing with a more detailed inset of a silicon diode in a slit in a Pacific madrone tree (Arbutus menziesii). Polyethylene electrically isolates the diode from the xylem of the tree. The voltages produced in the diode were often very large compared to typical bioelectric voltages observed from probes in plants. The leads coming from the diode are indicated by the arrows. The output from the diode is connected directly to the strip chart recorder located on a table beside the tree. The schematic diagram (capacitors and diode) indicates the approximate equivalent circuit of the diode in the tree with the N side up (reverse of what was normally used to measure the highest voltages). See Wagner 1993. Note that the voltages were checked and calibrated with a calibrated Keithley digital multimeter. The multimeter and the strip chart recorder had internal impedance's of 11 and 10 megohms respectively.
The energetic processes indicated by the relatively high power densities suggest that sap flow and other plant processes are energetic processes rather than the almost passive processes proposed by plant physiologists. The relatively large energies considered here are consistent with the well known emission of biophotons from life forms (e.g. Chan 1997) with "wavtons" perhaps converting to the photons that are observed to be emitted by life forms especially if the life form is healthy (biophotons have not been observed coming from dead material). And of course the existence of biophotons also suggests that life operates with waves!
W-WAVES OUTSIDE OF PLANTS
Some might like to say that waves in plants are purely chemical waves. For one thing the wave velocities are much too great for chemical waves. Then the waves seem to travel between root isolated plants at velocities five times as large as the velocity within plants (Wagner 1989, 1995). In early 1997 I reasoned that tubes such as glass tubes might be resonators for standing waves of W-waves since the waves appear to be everywhere. To test the hypothesis I placed dust in level tubes with closed ends and rotated them slowly. Perhaps the rotation would permit the dust to move to locations indicating wave action. On actual rotation I noticed that the dust tended to run up one side of the tube and slowly flex along the tube. The dust then tended to pile up quasiperiodically along the tube. Using dust with a gradation of particle sizes worked best with resultant quasiperiodically placed regions of course and fine particles with course particles apparently coming out at antinodes. I reasoned that the hypothesized waves in the tubes had a dominant influence on the placement of the structures. I rotated level 15 mm, 20 mm, 25 mm and 37.5 mm diameter closed end glass tubes containing thin layers of dust particles (e.g.Wagner 1998). These tubes were rotated as slowly as 1/12 revolution per second and as fast as 2 rev/s with the resulting patterns becoming more complex the more slowly the tubes were rotated. One can extrapolate from graphs of the data to the non rotating tube mean frequencies (Table 4).
| 0 REV/S | 1/12 | 1/8 | 1/6 | 0.21 | 0.28 | 0.35 | 0.8 | 1 | 2 | |
| 15 MM | 104 | 100.3 | 95.5 | 63.1 | ||||||
| 20 MM | 88 | 82.2 | 71.5 | 38.4 | ||||||
| 25 MM | 71 | 67.8 | 67.5 | 42.2 | ||||||
| 37.5 MM | 61 | 58.7 | 51.1 | 34.8 |
TABLE 4. Mean frequencies taken from dust tubes for various diameters and rotational velocities. Frequencies are found by measuring and recording the distance between centers of course particle locations and dividing them into one half of 240 cm/s. The numbers for zero rotational velocity were found by graphical extrapolation.
Slow rotation permits the particles to move to equilibrium
positions. The spacings between structures became shorter on average or the
apparent frequencies higher the more slowly the tube rotated. This is exactly
opposite to what would be expected if the spacings were due to sound. Also the
smaller the tubes the shorter the spacings on average. The frequencies that
occurred most frequently tended to repeat from tube to tube under all conditions
as in plants as the averages changed. The pattern spacings tended to fluctuate
from day to day. If certain electromagnetic sources (such as a properly operating
vacuum tube) were placed near a rotating tube these seemed to stabilize the
patterns so that they changed very little over time after equilibrium was attained.
The patterns obtained seemed to be dependent on the orientation of the tubes.
I was routinely able to obtain a wave patterns with time dependent spacings
producing frequencies identical to typical plant frequencies. Comparing them
by laying one spectrum over another, if one calculated the frequencies using
240 cm/s, it was found that the main peaks almost matched in relative amplitudes
( 240 cm/s is 1/2 the velocity found for W-waves outside of plants in plant
communication experiments) (Figure 7). Note that one might expect W-wave velocities
to be smaller in tubes than in open air or larger than in plant stems (see Wagner
1996 and the variable velocities observed). It is quite surprising that dust
layers in glass tubes and plant stems are comparable at all.
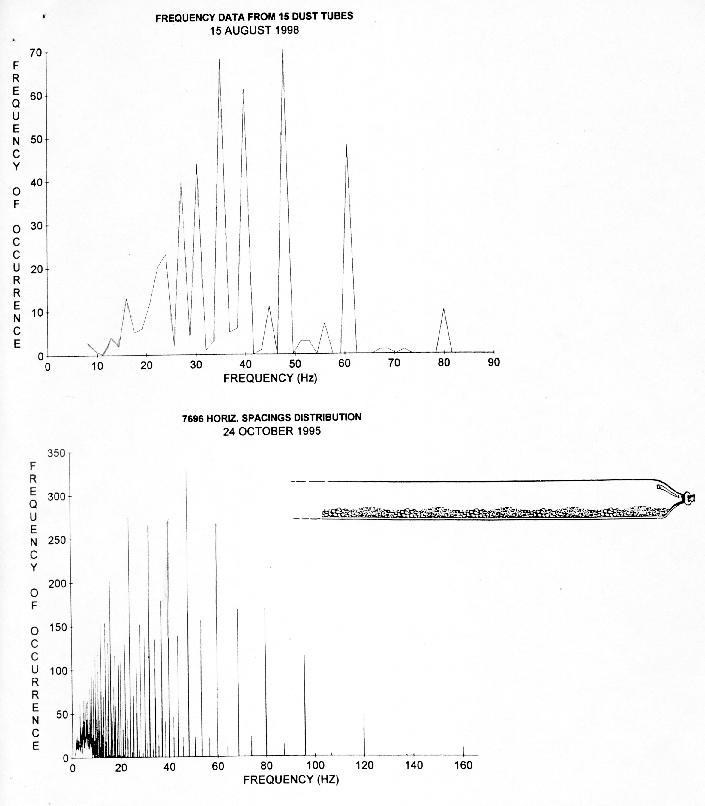
FIGURE 7. The upper graph represents the distribution of reciprocals of spacings (multiplied by one half of 240 cm/s) obtained from 15 different rotation and diameter conditions of rotating dust tubes (478 spacings) (also e.g see Table 4). The drawing represents part of a typical dust tube. The lower graph is a frequency distribution of 7,696 horizontal internodal spacings from 15 different species of plants (Wagner 1996 p.190.). Note how main peaks match in both cases. The matches obtained tend to confirm that similar waves are involved in both cases.
So far it appears that the dust tubes are W-wave resonant tubes which seem to work anywhere. They were tested in three locations up to 50 miles apart. I also found that electromagnetic sources seem to excite W-waves everywhere. They can be measured using proper W-wave detectors (Wagner 1996). Suffice to say that my other publications carry W-waves out to the solar system and beyond with consistent wave behavior everywhere indicated (see all the Wagner references especially Wagner 1995 and Wagner 1999).
The arguments that the wave patterns in tubes are due to sound waves or purely flexure waves without W-wave influence tend to be ruled out by the following:
CONCLUSIONS AND OBSERVATIONS
The simplicity of the experiments with their results provide some of the best arguments in favor of W-wave operation of plants. Apparently plants do not exist without W-waves and this is likely true of all life. This may be the reason no one so far has been able to produce life in the laboratory because life requires a proper resonating W-wave structure to exist! The rules provided by W-wave mechanics provide a template on which life can develop. The consistent wave behavior everywhere also provides other arguments in their favor. Most of the experiments have been repeated many times during the eleven year period of study, so far, with always consistent results. I believe that the behavior of plants may provide a key to the behavior of the vacuum (with or without ordinary matter present) with its unlimited energy (zero point energy) that several laboratories are trying to harness at this time. W-waves may not only show us how to grow better crops but also may provide us with a better understanding of the very basics of nature. It is hoped that this study will inspire the reader to read the available literature to get more detail and perhaps proceed with experiments of his own especially since fundamental experiments are so easily repeatable and inexpensive to do.
REFERENCES
| Copyright ©2000-2018 Wagner Research Laboratory |
 Waves in Dark Matter